1
2
3
4
5
6
7
8
9
10
11
12
13
14
15
16
17
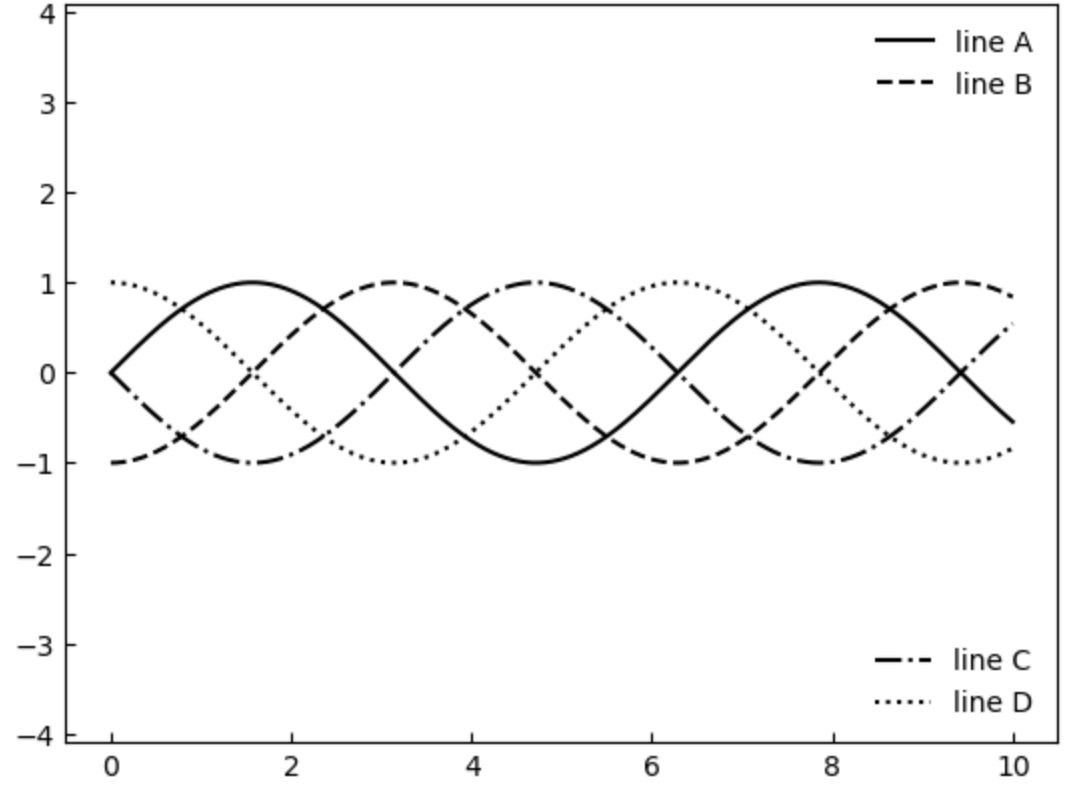
| fig, ax = plt.subplots()
lines = []
styles = ['-', '--', '-.', ':']
x = np.linspace(0, 10, 1000)
for i in range(4):
lines += ax.plot(x, np.sin(x - i * np.pi / 2),
styles[i], color='black')
ax.axis('equal')
ax.legend(lines[:2], ['line A', 'line B'],
loc='upper right', frameon=False)
from matplotlib.legend import Legend
leg = Legend(ax, lines[2:], ['line C', 'line D'],
loc='lower right', frameon=False)
ax.add_artist(leg)
plt.show()
|